


🌬️ Breathe Smart, Live Better — Your Home’s Air Guardian
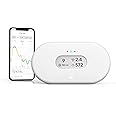
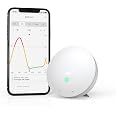
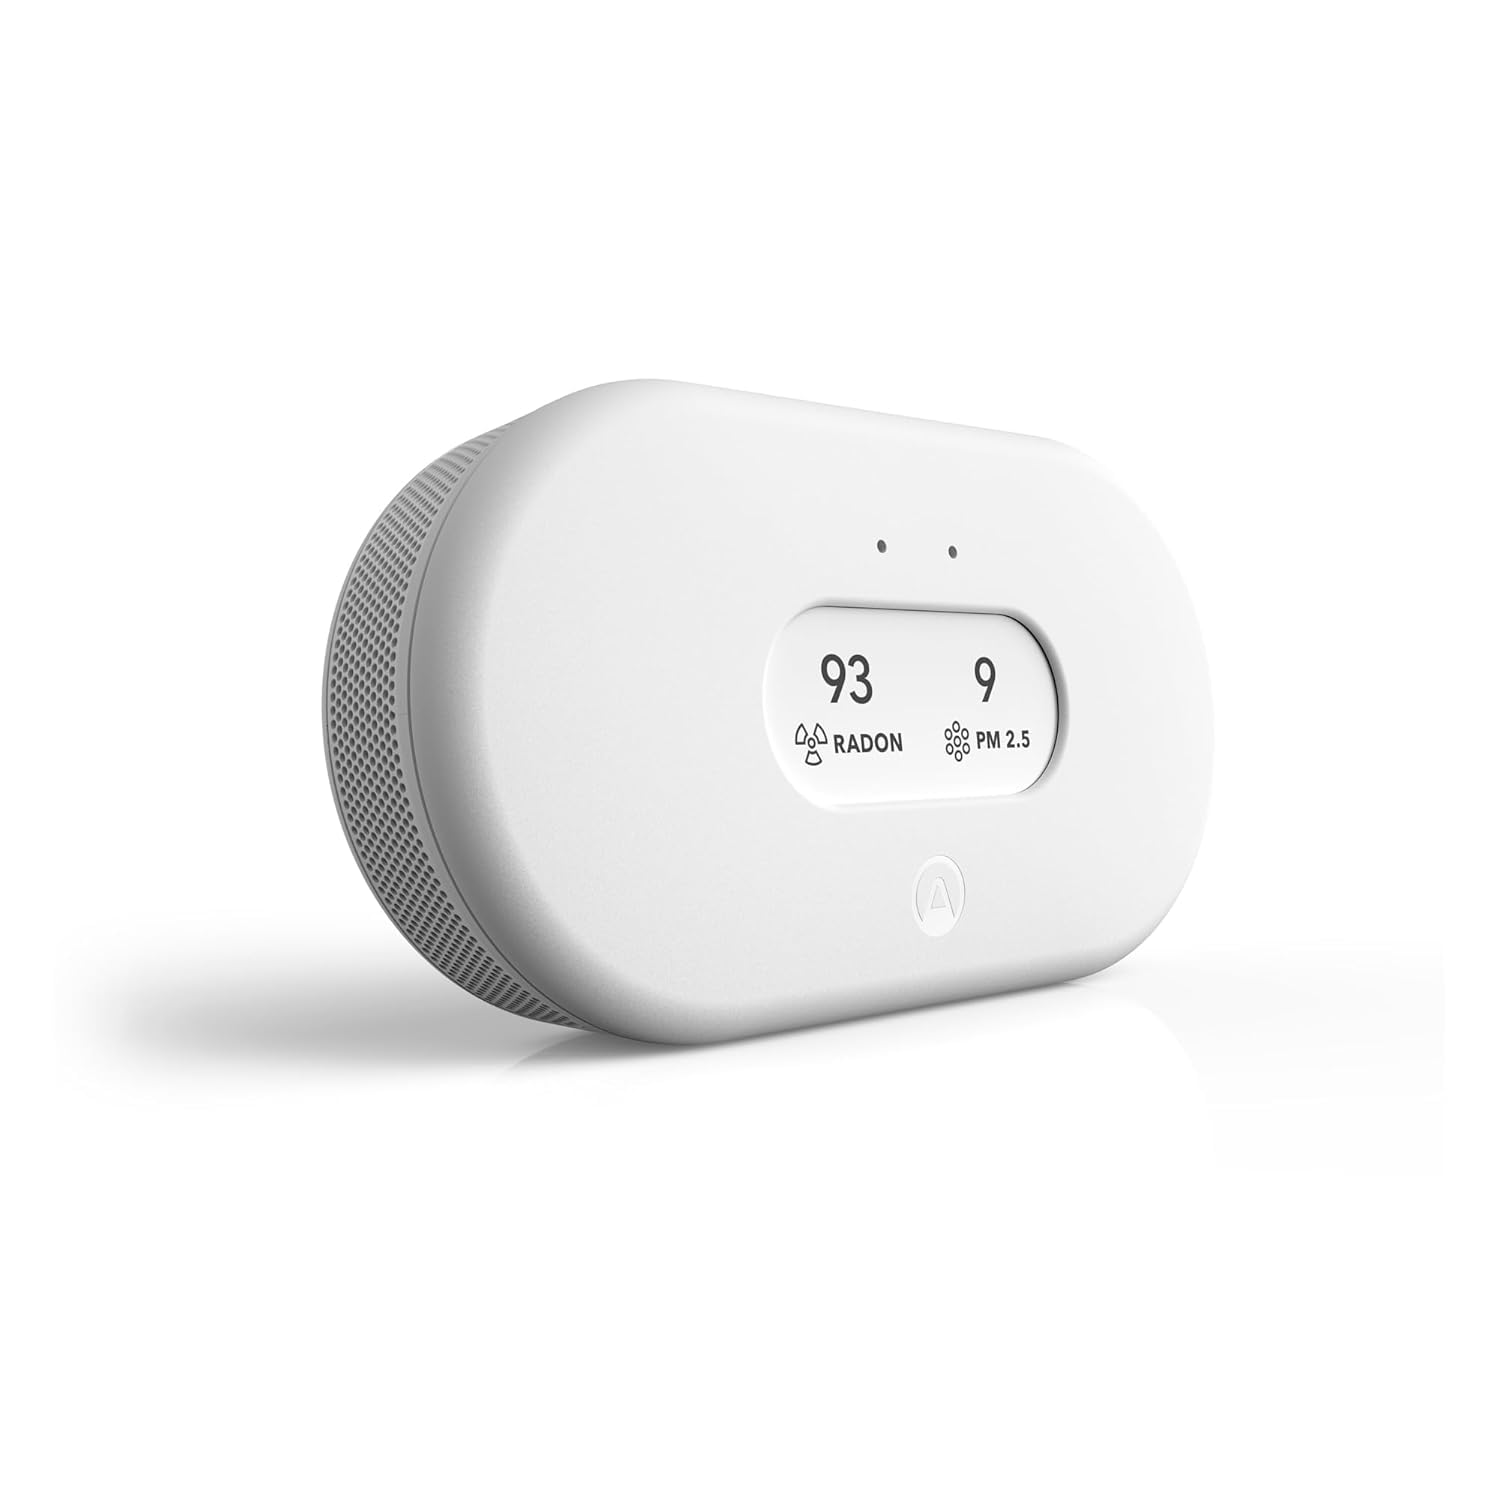
The Airthings 2960 View Plus is a battery-powered, WiFi-connected indoor air quality monitor featuring seven advanced sensors that track radon, PM2.5, CO2, VOCs, humidity, temperature, and air pressure. Trusted by over a million users, it offers accurate digital radon detection with a passive diffusion chamber and alpha spectrometry, continuous real-time monitoring, and seamless integration with smart home systems. The device includes a customizable eInk display, a user-friendly app for live data and alerts, and a long-lasting 2-year battery life, all backed by an optional 5-year warranty.


| Brand | Airthings |
| Style | View Plus |
| Power Source | Battery Powered |
| Color | white |
| Product Dimensions | 4"D x 4"W x 2"H |
| Item Weight | 0.36 Pounds |
| Alarm | Visual |
| Operating Humidity | <85% |
| Compatible Devices | Airthings View series, Airthings Hub, Alexa, Homey |
| Upper Temperature Rating | 104 Degrees Fahrenheit |
| Sensor Type | radon detector |
| Material | 1 |
| Number of Items | 1 |
| Manufacturer | Airthings |
| UPC | 854232008224 |
| Part Number | 2960 |
| Item Weight | 5.8 ounces |
| Item model number | 2960 |
| Batteries | 6 AA batteries required. (included) |
| Shape | Circular |
| Thickness | 9 Centimeters |
| Item Package Quantity | 1 |
| Temperature Range | 39.2°F to 104°F Degrees Fahrenheit |
| Measurement Accuracy | Radon: After 7 days: σ ~ 10 % at 5 pCi/L |
| Display Style | calm tech display |
| Included Components | Air Quality Monitor, 6 AA batteries, USB C cable |
| Batteries Included? | Yes |
| Batteries Required? | Yes |
| Battery Cell Type | Alkaline |
| Average Battery Life | 2 years |
| Warranty Description | Airthings has a 5-year extended warranty available on all air quality monitors for consumers. Registration is required within 30 days of the purchase on the Airthings website. Registration is free and your statutory rights are not affected. |
N**K
YYYYup
I have had this unit for almost 2 years now, I will buy another. It literally saved my life!If you work from home, like I do, then you need this unit or something like it. I had Radon levels above 7pCi/L and had been living with it without knowing it, for almost 3 years. For those that don't know, Radon is a radioactive breakdown of uranium, thorium, or radium in rocks, soil, and groundwater. The CDC and EPA claim that levels above 4pCi/L are considered highly toxic and proper mitigation should be taken to reduce the levels. This is why Radon mitigation systems are installed in nearly every home across the United States.If you don't know, educate yourself about Radon and understand that radon causes over 21,000 lung cancer deaths in the United States each year and 2,900 of those deaths are people that have never smoked a day in their lives! For me, every now and then, I would cough and a small spat of blood would sometimes appear and i could never figure out why...Now, do you NEED this system?- Absolutely not, there are plenty of radon detectors out there and they are pretty cheap.Why do I recommend this system and why did I choose it?- Historical Data: This bad boy tracks all of your air quality metrics over time. This is extremely important when you want to understand cause and effect in anything in life. Many of the "bad reviews" talk about how some of the metrics displayed are inaccurate when compared to another device that specializes in one or many of the metrics this unit does display. Accurate comparisons only matter when comparing against a controlled environment and are purely for the sake of argument. This is important to understand because no unit needs to be 100% accurate, it just needs to be accurate to itself so that when you make a change, you can properly see that the change is affecting the metrics in a way that makes sense for what you meant to accomplish.For example, I had high radon (the value of the metric didn't matter other than the fact that it is higher than 0... it's radioactivity, is anything above 0 TRULY acceptable?) When I installed my radon mitigation system, I could watch my Radon levels drop tremendously over time, which proved that my radon mitigation system was actually working as expected! Also, I haven't had any spots of blood appear when I cough... I call this a success.- Dashboard: Airthings has a nice application and semi-customizable dashboard which makes viewing really easy to do, and from anywhere in the world. When my pets are home while the family is away, I can notify my neighbor to open a window to let some fresh air in, while we're away.- Alerts: Always cool to have alerts so you don't even need to "monitor" the metrics. Fun fact, CO2 builds up pretty rapidly in a well-sealed home. When you go through insulation techniques to seal off cracks and crevices to improve your HVAC efficiency in the thermal zone, it is easy to forget that CO2 has no easy escape. Needless to say, this little guy alerted my phone and I was able to crack a window and keep my family safe. I later installed a fresh air intake on my HVAC system and again, could watch the metrics historically, as they fell to a more than acceptable range, yet again proving that my air intake installation was actually doing its job.I hope this helps anyone looking to decide on this purchase. It has been an absolute godsend to have in our home and I didn't even get into some of the other things it helped me solve that had been plaguing us.
J**S
Great product after 6-8 months use, worth the $$$
Purchased this to track radon in our mostly-finished basement area. Wanted (1) A product that was wifi connected that could (2) track radon and humidity levels over a long period of time, (3) offered some kind of long-term dashboard/UI that was easy for human consumption, and (4) gave some level of warning if levels were astronomical.While spendy, this product was one of the only ones to check off all the boxes. I considered going with the bluetooth-only model to save money, but I'm really glad I didn't. The convenience of getting alerts from anywhere, seeing results any time of day or night is really worth the extra coin.I'll admit, Airthings really needs to work on their alerting system. Getting alerts about CO2 when working out in its vicinity, particulate matter alerts when cleaning, it's a bit annoying when the main alerts I want to see are radon and humidity, and I really wish they would allow you to set your own thresholds, but the smartphone app's UI and usability is exceptionally good and the product is easy to work with.My other nitpick would be battery life and/or no rechargeable batteries. The supplied batteries lasted for a solid 100-120 days or so. I replaced with my normal Energizer long-life battery and got maybe 75 days out of those before changing a couple weeks back to the next set. I usually can tell when the batteries are going because sometimes the results get a little crazy. I'd also like smartphone app alerts when the battery levels are, say, below 20% but I don't see that option. I mean, I'd love to just plug the unit into a power adapter and forego batteries totally, but I don't recall if it was an option on this unit, and batteries have sufficed. I may look into that later.Overall though, yes, it's expensive. But for constant monitoring, with alerts, to monitor all sorts of airborne levels, ACCURATELY, there isn't another product on the market I could find. I'm a satisfied customer, with a little polish in a few places, I could really see Airthings becoming a household name to the level that Ring and Nest have become. Great little product here!
Trustpilot
1 month ago
1 day ago